Skip to content

Using GA4 can be a learning curve for many of us – but Google is doing its best to make life easier by updating the tool regularly.
However, navigating to Google’s release notes and understanding the impact of these updates isn’t the most intuitive process when we’re swept up in day-to-day business.
That’s why we’re stepping in to explain, in clear terms, what the latest GA4 updates mean – and why you should care about them.
Let’s take a look at plot rows.
Plot Rows
Overview
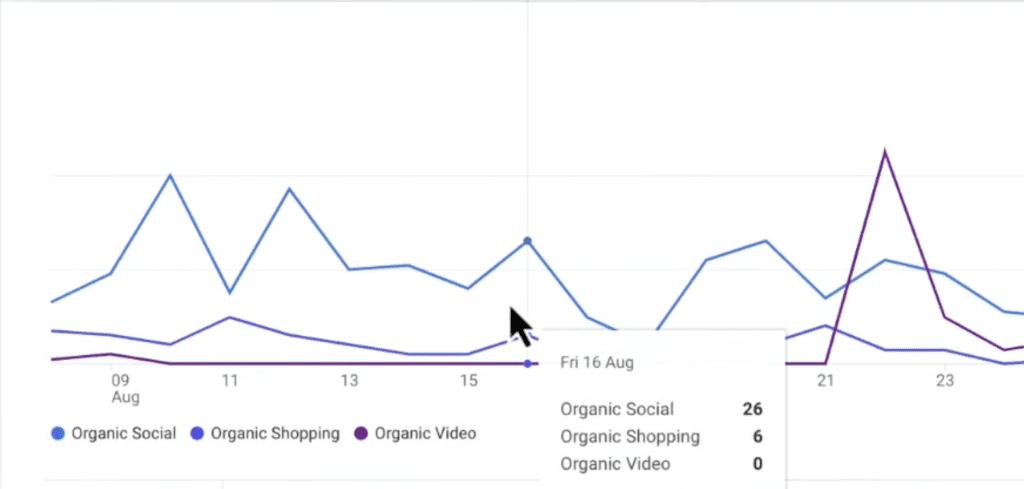
It’s now possible to visualise and compare multiple metrics directly within reports. For example, you can plot paid search and organic search against overall session trends.
This feature allows businesses to quickly identify the performance of different channels, speeding up decision-making and making it easier to respond to trends or issues across marketing strategies.
What was happening before?
- Businesses needed to create individual reports for each metric or traffic source
- The data would need to be exported and manually plotted to graph the trends side by side
What happens now?
Users can select multiple metrics within the same report, eliminating the need for multiple reports
Trends can be visualised directly within the platform, so users no longer need to export data and manually plot them
What does it mean for me?
Instead of building in time to manually compile data before analysis can begin, you can skip this step and jump immediately to viewing instant insights within a single report.